They manage trillions and vote on boardroom pay across thousands of companies, yet many of the world’s largest asset owners still have no clear system for measuring whether executive pay actually drives performance. Compensation expert Stephen F. O’Byrne tells The European what they’re getting wrong — and the metrics they should be using instead
When an investment giant like Norway’s sovereign wealth fund or California’s CalPERS pension votes on a company’s executive pay plan, it’s not a small decision. These organisations — often referred to as “asset owners” — represent trillions in capital and hold stakes in thousands of companies. They can approve or reject CEO pay packages that run into the tens of millions, and their decisions shape boardroom behaviour around the world.
But here’s the problem: many of these powerful institutions are making decisions about incentives without a consistent system for measuring whether those incentives actually work.
“There’s a real gap here,” Stephen F. O’Byrne, founder and president of Shareholder Value Advisors, a consultancy specialising in performance-based pay systems and shareholder alignment, told us. “Asset owners are expected to evaluate how well pay is aligned with performance, but most have no reliable method for doing that — especially across different types of organisations and incentive structures.”
A former senior executive at Stern Stewart & Co. and an expert contributor to the Harvard Business Review and Journal of Applied Corporate Finance, O’Byrne has spent decades working with boards, institutional investors and governance bodies to improve the link between pay and value creation.
The challenge, he explained, is that large asset owners don’t just oversee one kind of pay system. Their performance depends on incentives across six distinct levels: their own trustees, internal staff, external managers, the boards of companies they invest in, corporate executives, and the wider employee base. Each layer influences returns — and each comes with its own logic for pay and performance.
What’s missing, according to O’Byrne, is a way to compare these different incentive models on equal terms. His solution is a four-part framework that looks beyond pay figures to ask how compensation behaves. It measures incentive strength, pay alignment over time, cost efficiency at average performance, and the level of risk an individual takes on relative to company outcomes. When combined, these four dimensions offer a far clearer picture of whether a pay structure encourages good decision-making and long-term value.
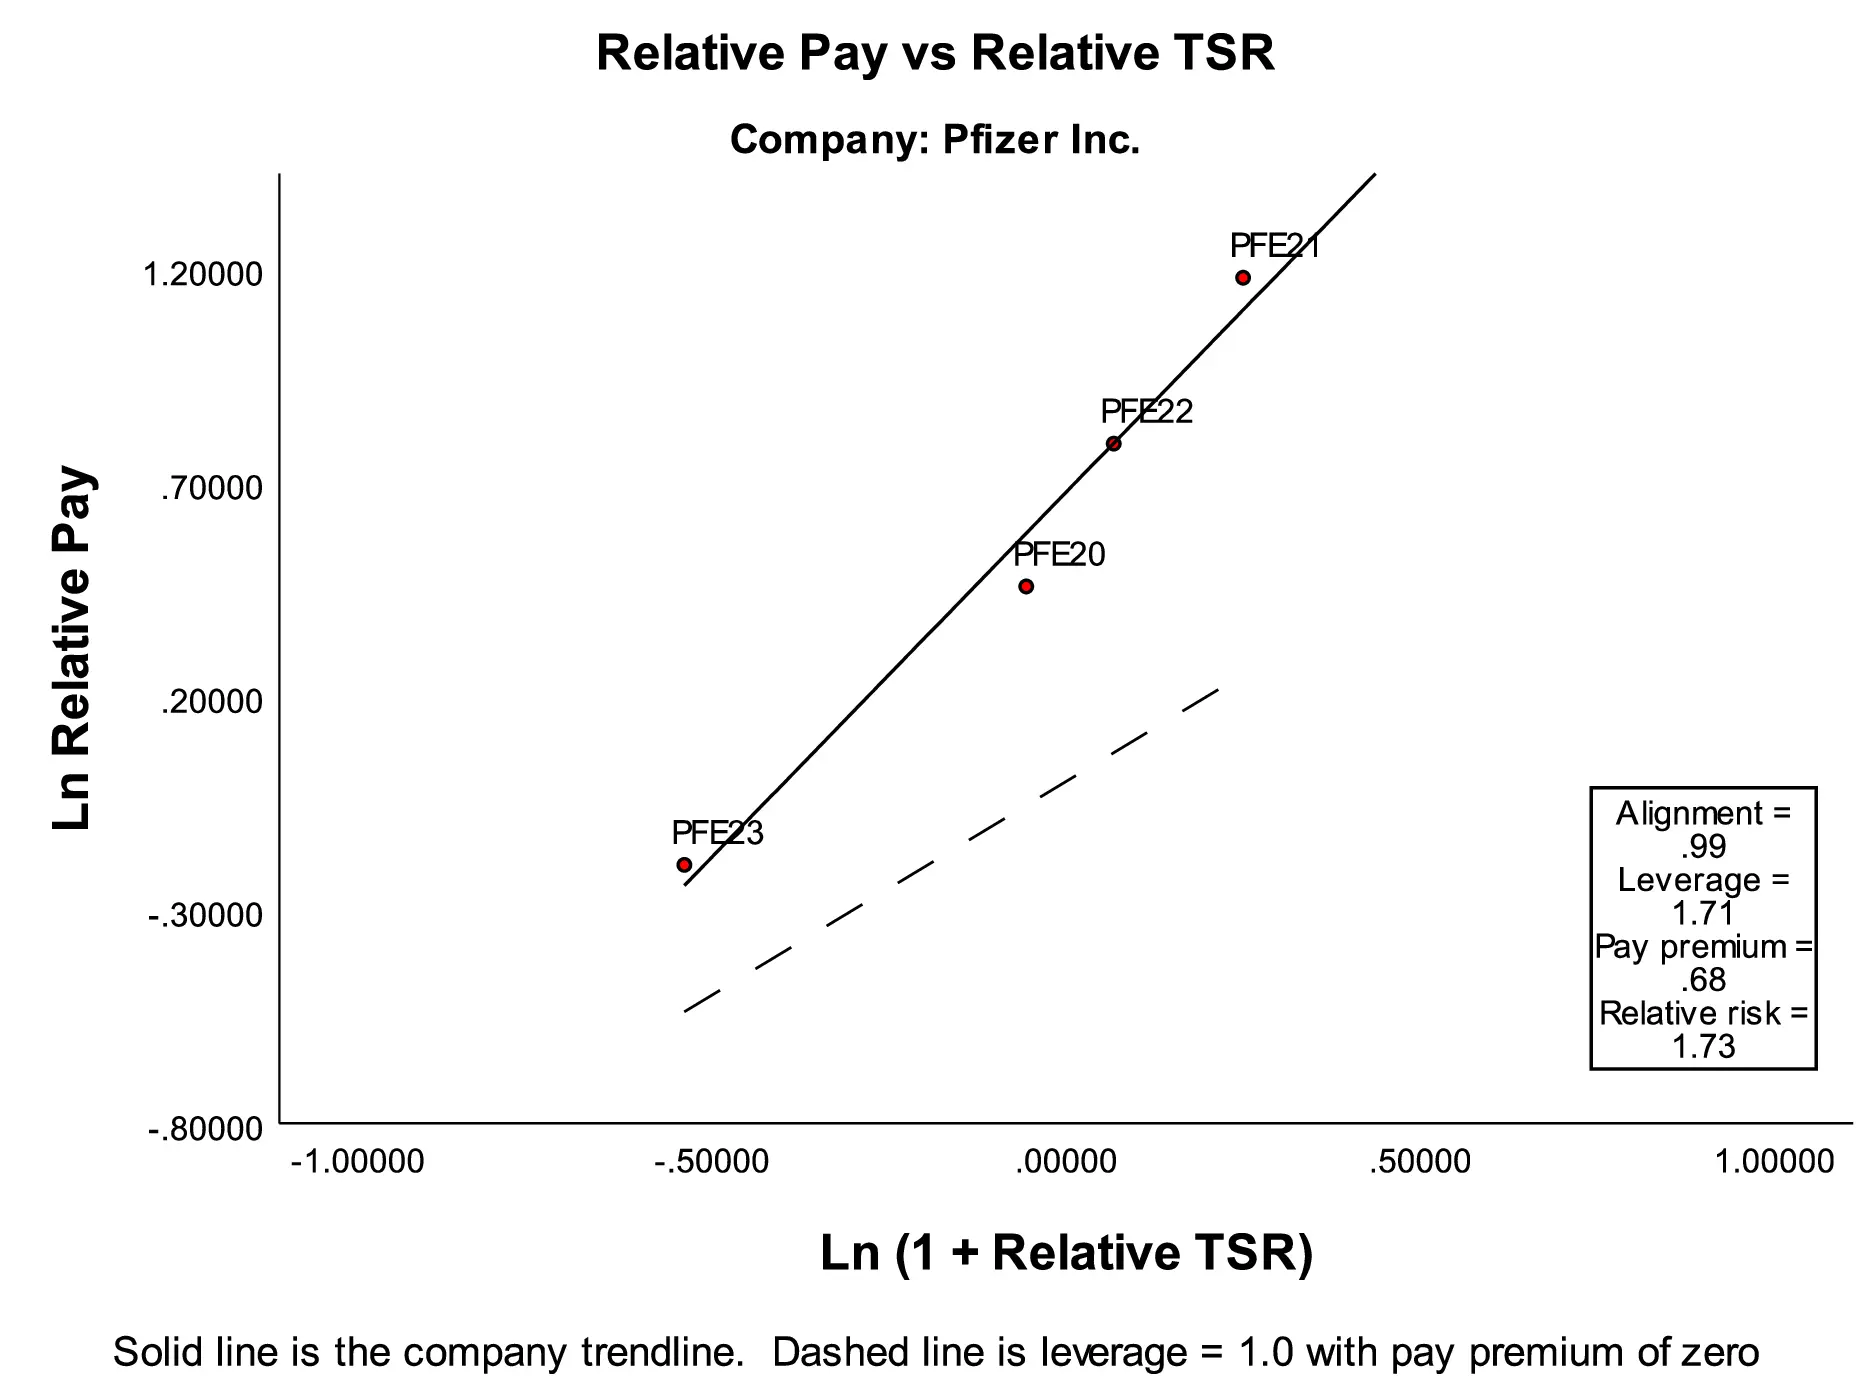
He illustrates the point with newly available Pay Versus Performance (PvP) data, now required by the US Securities and Exchange Commission. These disclosures allow analysts to track how CEO pay evolves over time compared to total shareholder return (TSR), using relative, peer-adjusted figures.
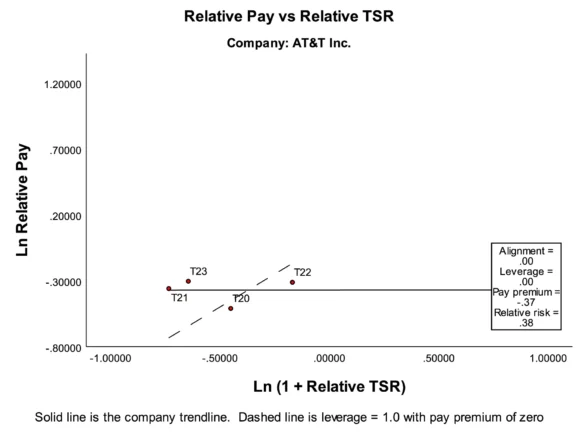
At Pfizer, for instance, CEO Albert Bourla shows a strong correlation between pay and performance. A 1% rise in shareholder value leads to a 1.71% increase in his relative compensation — what O’Byrne terms “pay leverage”. At AT&T, the same analysis reveals no meaningful relationship at all. CEO John Stankey’s pay remains unchanged whether TSR rises or falls.
That kind of contrast is only visible when you move beyond surface metrics and look at the slope and structure of the pay-performance relationship. The intercept of that line — where it crosses the axis at average market performance — gives another important insight: how much pay a CEO receives even when results are unremarkable. In this case, Bourla receives nearly double the average compensation of his peers at average performance, while Stankey earns significantly less.
These comparisons are captured visually in Figures 1 and 2, which show scatterplots of each CEO’s relative pay plotted against relative shareholder return. The steep upward slope of the Pfizer trendline contrasts starkly with AT&T’s flat, non-responsive curve — highlighting how incentives differ in practice as well as principle.
SEC disclosures allow analysts to map pay against shareholder returns over time. Pfizer CEO Albert Bourla’s incentives rise with performance, while AT&T’s John Stankey’s pay remains flat regardless of outcome — a key signal of poor alignment.
“Charts like these reveal the stark differences in how companies approach incentives,” O’Byrne explained. “And when the signals are wrong, the financial consequences can be enormous.”
But incentive strength and cost alone don’t tell the full story. O’Byrne’s framework also breaks pay leverage into two deeper components: alignment and risk. Alignment reflects how tightly pay follows performance across time, while relative risk shows how much a CEO’s pay fluctuates in relation to company performance. In other words, it captures how exposed a leader is to the business’s ups and downs — a crucial element when evaluating whether they’re truly invested in long-term outcomes.
O’Byrne’s own research indicates that pay risk is a key predictor of future shareholder returns. When executives face more variability in their compensation — based on how the company performs — shareholders are more likely to benefit in the long run. Conversely, low-risk, flatlined pay structures often correlate with underperformance.
What Private Equity Gets Right About Incentives
To test the real-world impact of different incentive models, O’Byrne ran a large simulation based on ten-year return histories for over 28,000 S&P 1500 company periods. He replaced standard CEO pay with a structure more commonly seen in private equity: a fixed asset management fee, paired with a long-term performance bonus or carried interest. This PE-style system, he found, consistently produced stronger pay-performance alignment, especially in companies where traditional pay plans had previously failed.
In those simulations, nearly a third of firms achieved strong alignment and acceptable pay levels under the private equity model — double the rate seen in real-world PvP data from actual CEO pay. Even among “problem companies”, those with low alignment or extreme pay levels, the private equity approach delivered meaningfully better results.
It’s not that PE formulas are inherently superior, O’Byrne said, but that they’re structurally simpler and more directly tied to outcomes. Listed companies often layer their executive pay with short-term bonuses, restricted shares, performance hurdles and discretionary awards, which dilute the link between pay and performance. Private equity models, by contrast, reward long-term value creation and punish underperformance.
Time to Rethink the Tools We Rely On
Yet despite these insights, most asset owners have made little effort to build their own analytical tools. Instead, they rely heavily on proxy advisers like Institutional Shareholder Services (ISS), whose methodologies tend to emphasise surface-level comparisons, such as how much a CEO earns relative to peers. But these approaches rarely adjust for actual results — and provide no view into whether the pay structure is helping or hindering performance.
“The ISS model gives you a cost measure, but no sense of value,” O’Byrne said. “It tells you if someone is expensive, not whether they’re worth it.”
He believes it’s now time for asset owners to take back control — and to start applying the same standard of analysis to pay that they already apply to portfolio returns, capital allocation, or risk management. That means developing the internal expertise to analyse incentive structures across the board — from portfolio company CEOs to external fund managers, trustees, and their own executive teams.
“For the world’s largest investors, who sit at the centre of capital markets and corporate governance, that’s no longer a defensible position,” O’Byrne said. “The tools now exist. The data is available. What’s missing is the will to use it.”
Main Image: Figure 1
Figures 1 & 2: CEO Pay vs Shareholder Return